
A Better Knob Beats More Silicon: 12 vLLM Serving Experiments on H100s
Doubling my GPU count raised throughput 61% — and still lost to a one-line config change. A roofline-guided tour of what actually moves production serving metrics.

I recently ran a 12-experiment tuning study on a production-style vLLM deployment: a 4B multimodal model serving 400 concurrent users on Modal H100s. The single most useful result wasn’t a speedup — it was a loss. Eight H100s with default batching lost to four H100s with one config change. More silicon raised raw throughput 61%, but a better knob (max_num_seqs=64) delivered better latency and better cost-efficiency on half the hardware.
This post walks through what worked, what failed, and — maybe most usefully — where my own early measurements misled me. If you serve LLMs in production, the roofline model explains every result here.
(Context: this was my capstone for Vizuara AI Inference Engineering Workshop — a competitive serving benchmark. I’m omitting the leaderboard scoring formula and sticking to the engineering metrics that transfer: p95 TTFT, p95 inter-token latency, throughput, and error rate.)
The setup
Model: Qwen3-VL-4B-Instruct (text workload)
Stack: vLLM 0.21.0, OpenAI-compatible server, deployed on Modal
Hardware: H100 SXM (1–8 GPUs across experiments)
Load: 400 concurrent users, fixed prompt set, 90s sustained, max 96 output tokens per request
Metrics: p95 TTFT, p95 ITL, streamed chunks/s (SSE response chunks from the load generator — a proxy for token throughput), error rate
Note the regime: short generations (≤96 tokens) at high concurrency. That’s a chat/assistant-product profile — latency-sensitive, decode-heavy. Conclusions below are scoped to it.
The mental model: everything is the roofline
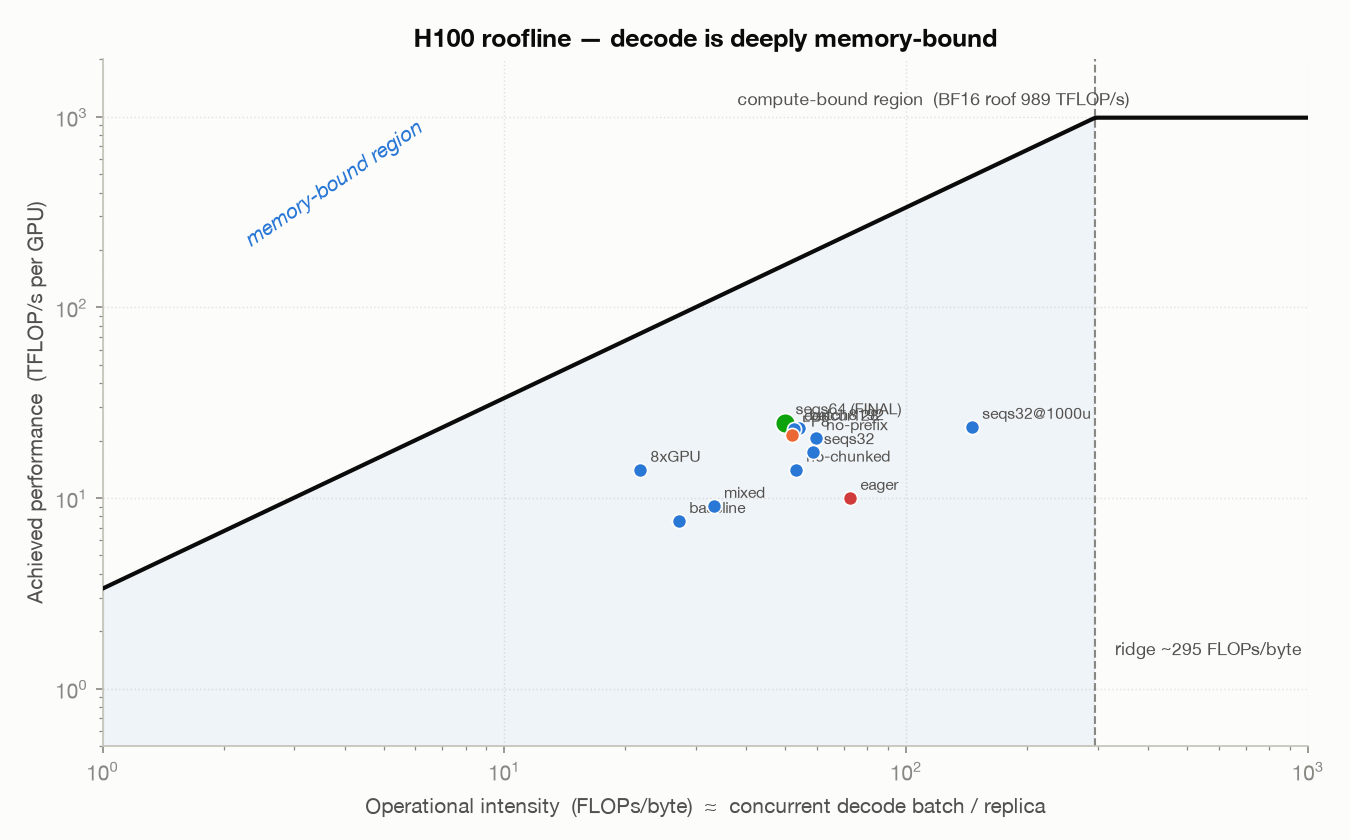
An H100 SXM does ~989 TFLOP/s (BF16 dense) and moves ~3.35 TB/s from HBM. Divide them and you get the ridge point: ~295 FLOPs/byte. Below that arithmetic intensity, you’re memory-bound; above it, compute-bound.
Prefill processes the whole prompt as large matrix–matrix GEMMs → high arithmetic intensity → compute-bound. It determines TTFT.
Decode generates one token per sequence per step → matrix–vector work that re-reads all model weights plus KV cache for very few FLOPs → arithmetic intensity roughly equal to the decode batch size → deeply memory-bound. It determines ITL and steady-state throughput.
Every one of my 12 experiments landed at an arithmetic intensity of ~20–150 — far left of the ridge. Measured compute was 1–2.5% of peak FLOPs. The GPU was never the bottleneck; the memory system and the scheduler were. Once you see that, every result below is predictable.
What worked
1. Compiled CUDA graphs: the single biggest decode lever. Decode launches thousands of tiny kernels per second. In eager mode, launch overhead dominated: p95 ITL was 24.2 ms. Capturing the decode step into a replayable CUDA graph cut it to ~6.5 ms — a ~4× decode speedup — and lifted throughput from ~5.0k to ~8.7k chunks/s on identical hardware. If you’re running vLLM in eager mode in production, this is likely your cheapest large win.
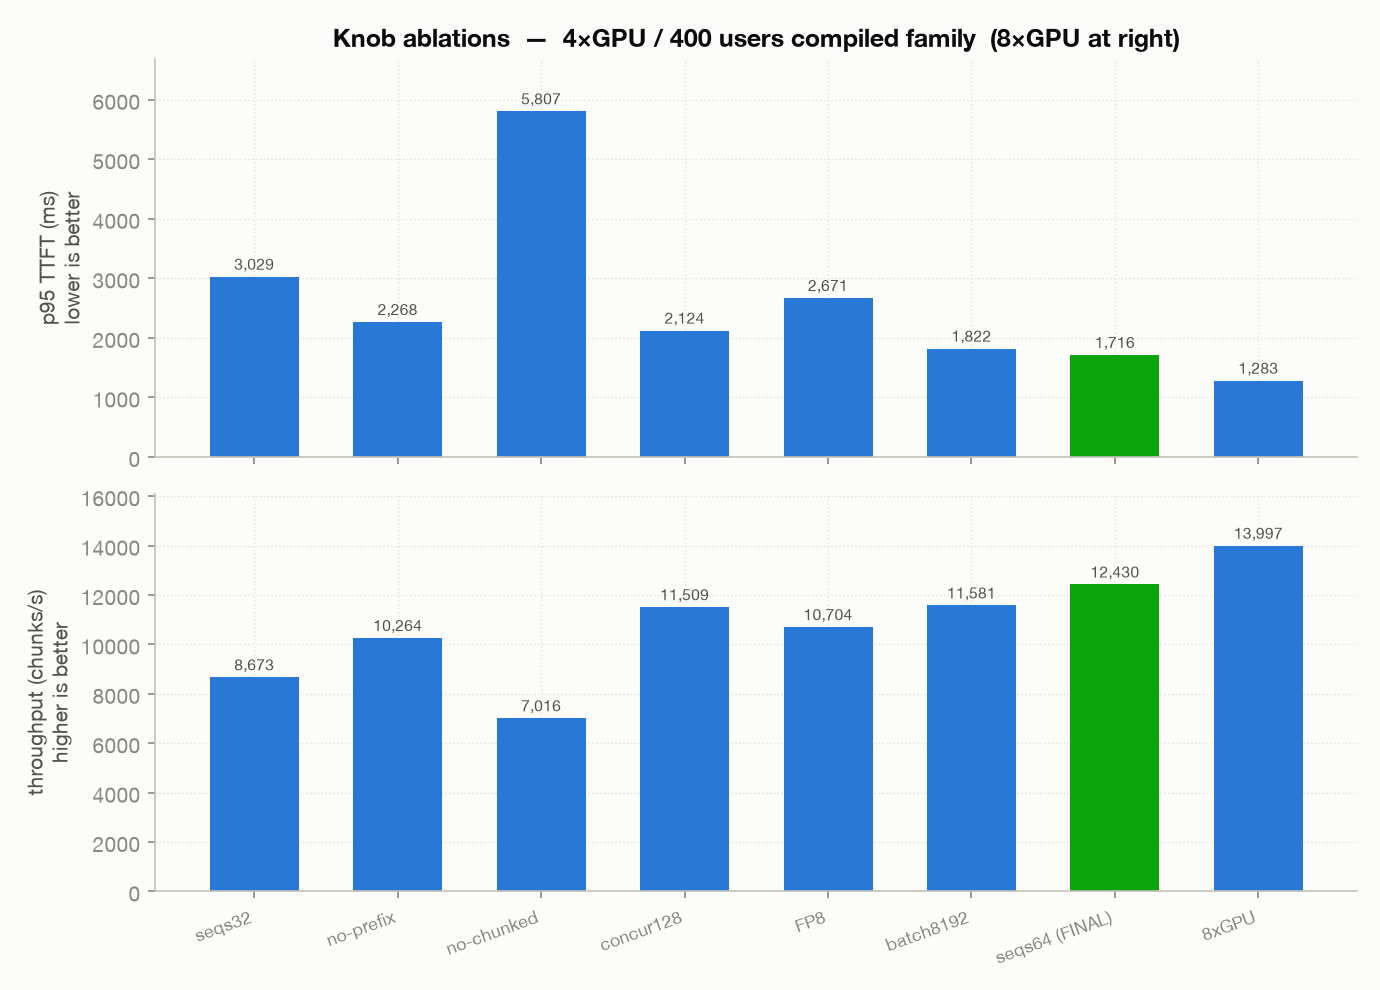
2. Raising the decode batch ceiling (max_num_seqs 32→64): the best cost-per-token knob. At 400 users across 4 replicas, each replica sees ~100 users. A 32-slot decode ceiling left requests queued; 64 slots let each replica amortize one weight read from HBM across twice as many tokens — moving the operating point rightward along the memory roofline. Isolated against properly warmed baselines, this knob was worth roughly +30–50% throughput, and it halved p95 TTFT in my final config because queueing collapsed. (More on why I’m quoting the corrected number, not the raw A/B, below.)
3. Chunked prefill: cheap insurance you should never turn off. With chunked prefill disabled, a long prompt’s prefill runs as one monolithic step that blocks the decode loop — classic head-of-line blocking. p95 TTFT nearly doubled (3,029 → 5,807 ms), p99 hit 7.9s, and request timeouts started firing. Worst single change in the study.
4. FP8 weights: best inter-token latency in the study. FP8 halves the weight bytes read per decode step. Result: the lowest p95 ITL of all 12 runs (5.6 ms). Against warm BF16 baselines the throughput gain was modest (~+4%) — the honest framing is that FP8 bought latency headroom, not a throughput transformation, at this model size.
What failed (and why that’s the interesting part)
More GPUs didn’t buy what you’d think. Scaling 4→8 replicas at fixed load raised raw throughput +61% (8.7k → 14.0k chunks/s) and gave the best TTFT of the study (1,283 ms). But per-GPU throughput fell ~20%: with only 50 users per replica, each replica’s decode batch halved, sliding left on the roofline into lower efficiency. On a cost-per-token basis, 4 GPUs with max_num_seqs=64 beat 8 GPUs with defaults. A better knob beat more silicon. If your finance partner asks why the GPU bill doubled but capacity didn’t, this is usually why.
Prefix caching did nothing — deliberately instructive. I expected a TTFT win. But my workload was diverse Q&A with almost no shared token prefixes, so the cache hit rate was near zero and its bookkeeping was pure overhead. Prefix caching pays off for shared system prompts, templated scaffolds, and RAG — not for unique-prompt traffic. Know your workload before you reach for the feature.
Load past the knee buys latency, not goodput. Pushing 400 → 1,000 users on the same 4 replicas barely moved throughput (already near saturation) while p95 TTFT exploded to 5.7s and ITL tripled. Past the saturation knee, extra concurrent users only deepen the queue. Find your knee before your users do.
Where my own measurements misled me
This is the section I’d want other engineers to read most carefully.
Compiled CUDA graphs have a long warmup. My first compiled baseline was under-warmed, and nominally identical configs produced wildly different results cold vs warm. The raw A/B suggested max_num_seqs 32→64 was worth +137%. Cross-checked against properly warmed runs, the isolated effect is +30–50% — still the best knob in the study, but less than half the naive delta. Same story for FP8: the raw comparison flattered it; warm-vs-warm, its repeatable win is latency, not throughput.
If your serving benchmark doesn’t include explicit warmup, fixed seeds, and repeats, your A/B deltas are upper bounds — possibly generous ones.
Final configuration
4× H100 (data-parallel replicas — no tensor parallelism; a 4B model fits on one GPU, and TP would pay NCCL latency on every layer for nothing), compiled CUDA graphs, max_num_seqs=64, max_num_batched_tokens=4096, chunked prefill and prefix caching on.
MetricFinal configMatched reference (same 4 GPUs)p95 TTFT1,716 ms1,942 msp95 ITL6.7 ms16.2 msThroughput12,430 chunks/s11,064 chunks/sError rate0.0%0.0%
Better on all three axes, inside the same hardware budget.
What I’d try next
FP8 + max_num_seqs=64 combined (each lever acts on different bytes — weights vs batch amortization); decode-optimized hardware (H200/B200 — higher HBM bandwidth directly raises the memory roof for a bandwidth-bound phase); and prefill/decode disaggregation with request routing to flatten the TTFT tail past 1,000 users.
Limitations
One model (4B, text mode), one fixed workload, short generations, one serving stack. The numbers are regime-specific. The method — roofline first, isolate one knob at a time, warm everything, distrust cold A/Bs — transfers everywhere.
I lead agentic AI engineering (consumer-scale conversational agents, LLMOps, evaluation infrastructure) and spent the last two decades shipping ML systems at Apple, Twitter, Shopify, and three startups. This post is part of an ongoing series on efficient agentic AI — next up: a benchmark study on when cross-request KV cache reuse is safe in agentic serving. Experiment harness, configs, and result JSONs: [GitHub repo link]. Find me on LinkedIn.